Mission Center: Slick-looking Stats for Linux
As a tech enthusiast, I’m always wondering what’s happening behind the scenes on my computer, as I do my day-to-day work. There are numerous methods to check your machine’s usage stats in Linux. From the terminal, you can use htop or btop, among many other options. But if you want to see your machine’s usage on the desktop, Mission Center is the one you’re looking for.
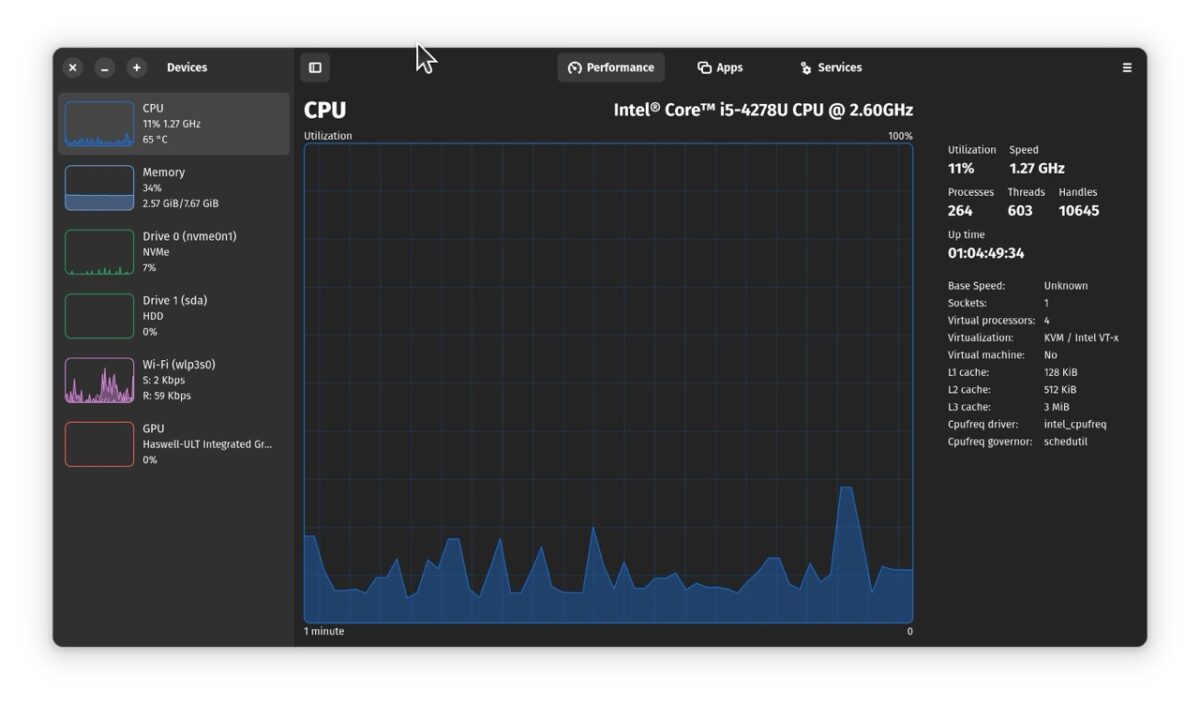
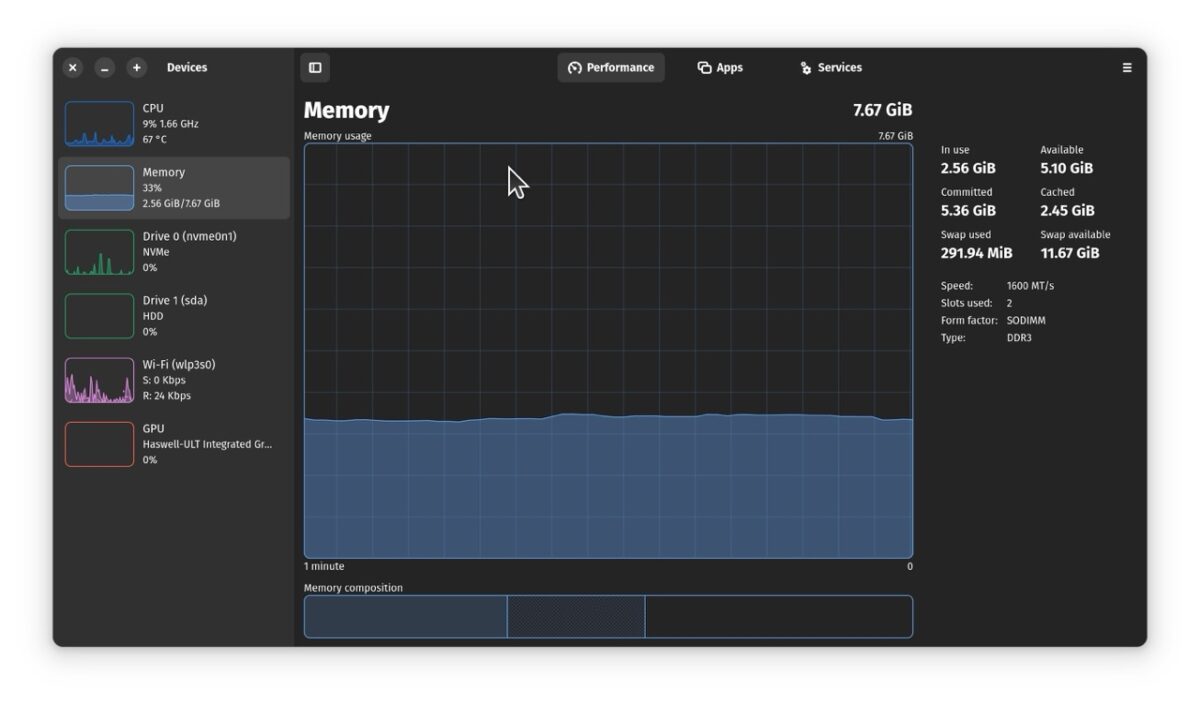
Like other apps in this category, Mission Center displays your machine’s CPU, memory, storage and GPU usage in a very clear, visual manner. The interface is broken down into three tabs. The leftmost tab is Performance, where you can see your machine’s CPU utilization in aggregate, or per core. In this tab, you can quickly glance at graphs for other parameters, such as memory utilization, network data traffic (incoming and outgoing), etc. Clicking on one of these graph thumbnails will give you the graph at full size.
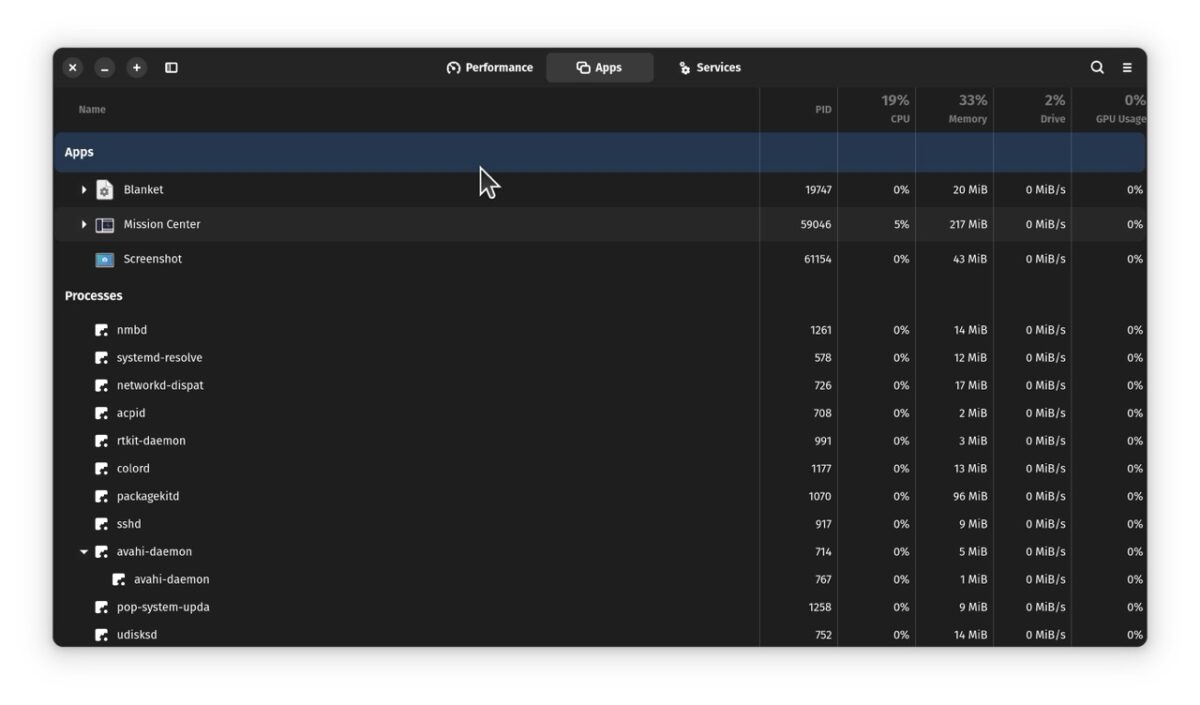
Mission Control’s middle tab focuses on App usage, where you can monitor how many resources each application is taking on your computer. It can be a great way to find resource “hogs”.
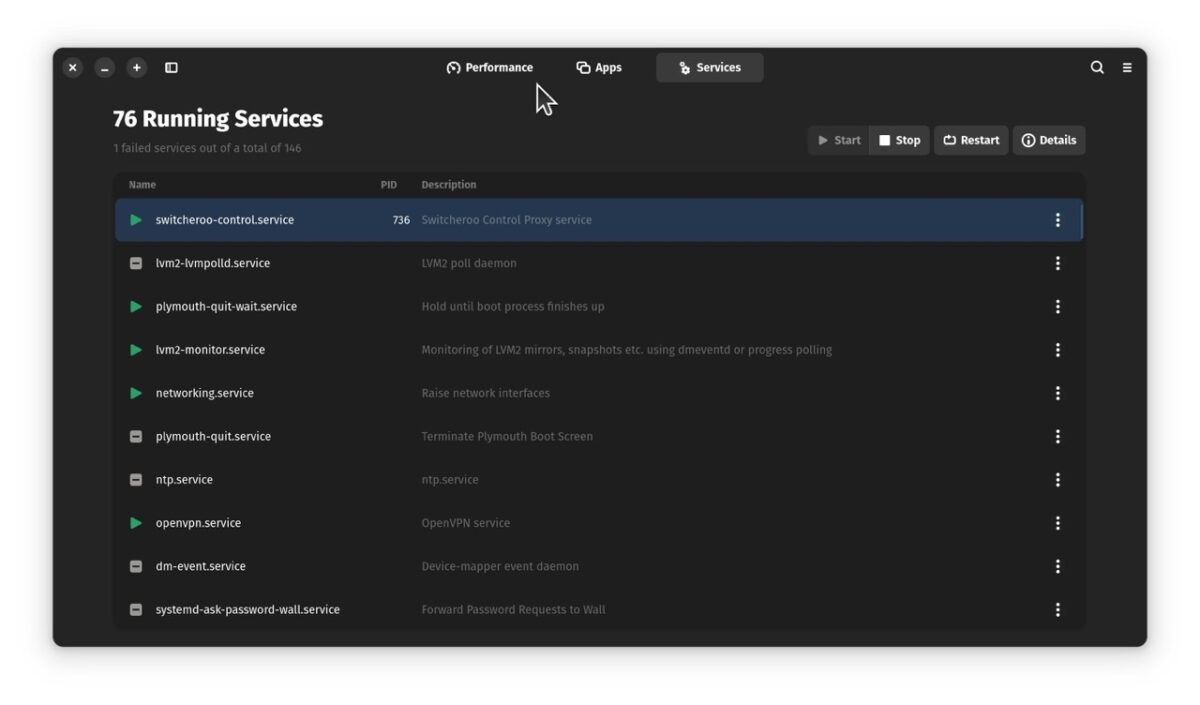
The right-most tab gives insight into all of the Services that are running on your computer.
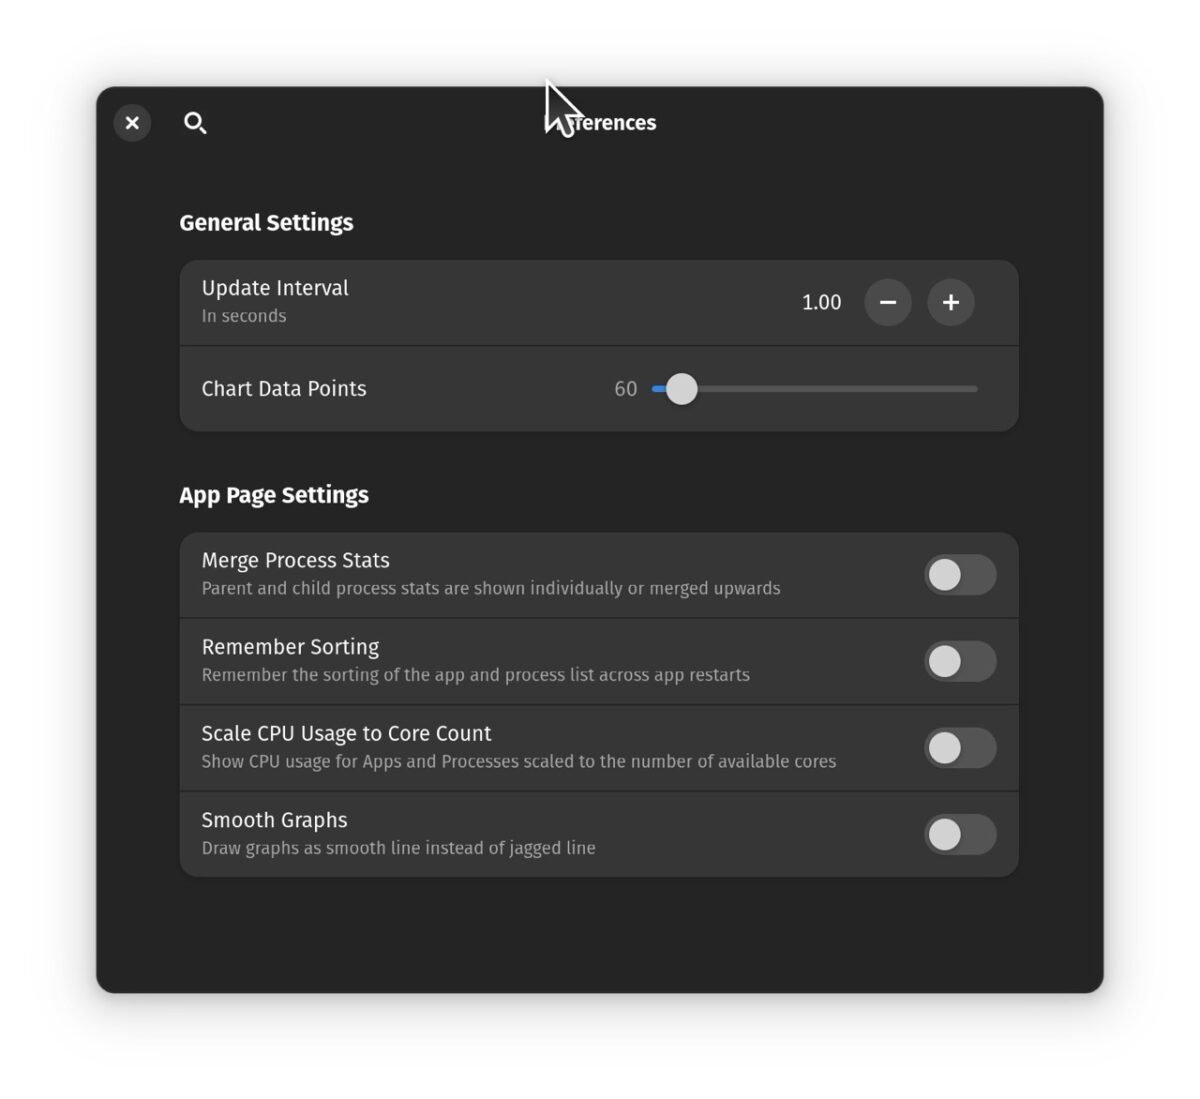
Mission Center has a few options when it comes to displaying information. You can find them in Mission Center’s Preferences window. You can adjust the update interval, smooth the graphs, and merge process stats.
Mission Center does a great job of providing detailed information of your machine’s resource utilization, in a manner that is accurate, visually clear and appealing. Mission Center is what I would call a polished Linux app. Its name provides context as to what the app’s functionality is all about, which is refreshing to see. (Linux app names are a topic for an entirely different blog post.)
Download the source or the Flathub for Mission Center from the developer’s website.
-Krishna


No comments yet. Be the first!